Understanding how Z-scores work and how to interpret them correctly helps laboratories make the most of their Proficiency Testing participation.
Proficiency Testing (PT) is widely used by laboratories to demonstrate technical competence, verify measurement accuracy and support ISO 17025 accreditation. A key element of any proficiency testing report is the Z-score, a statistical indicator used to evaluate how closely a laboratory’s result agrees with a population of laboratories average for a test sample. PT schemes do not normally have assigned values, it is simply to see how a user compares to others running the same test. If a Z-score is low, then the laboratory is measuring low compared to the average all of laboratories participating, not to an assigned value. Similarly, for if the Z-score is high.
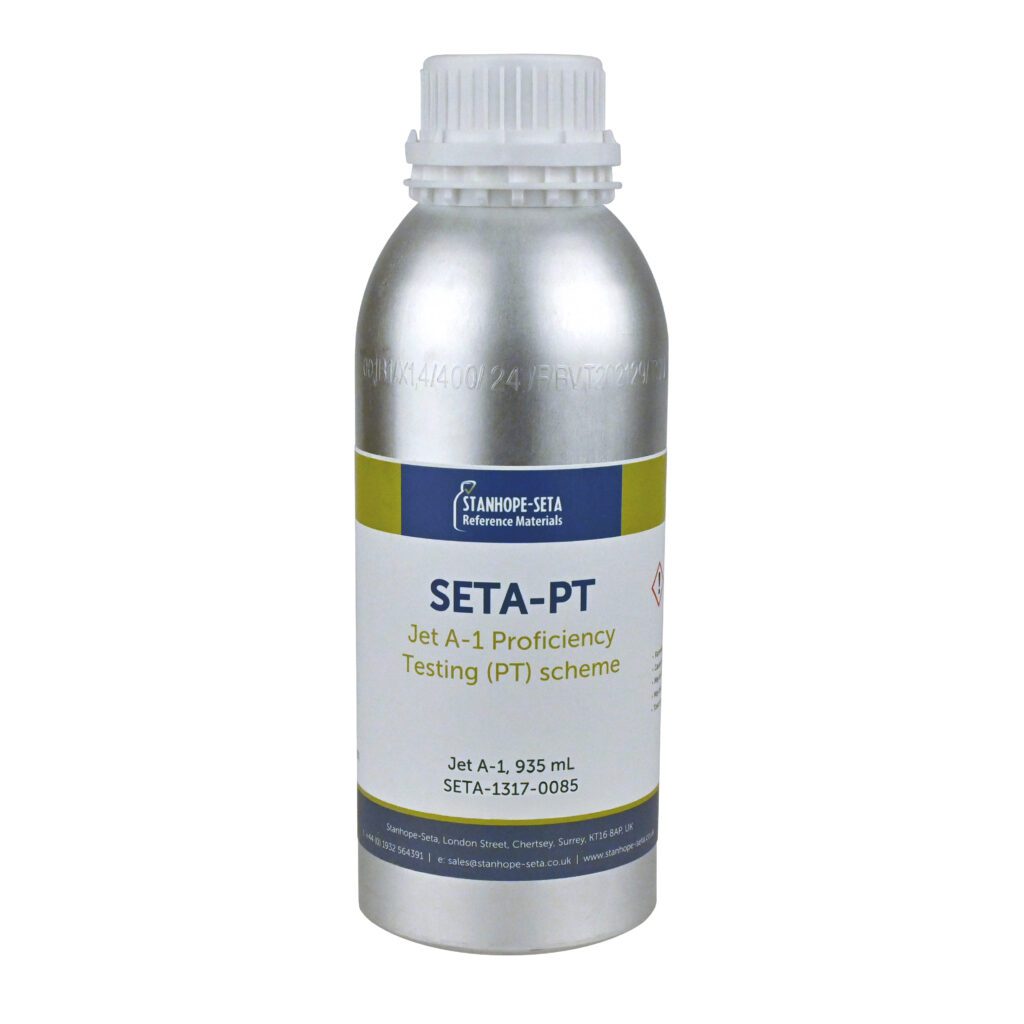
Laboratories using petroleum and fuel testing methods often participate in structured PT schemes such as the Jet A-1 Proficiency Test Scheme or the H₂S IP 570 Proficiency Test Scheme to monitor performance and benchmark results against peer laboratories.
What is a Z-Score?
A Z-score is a statistical value that expresses how far a laboratory’s reported result deviates from the PT round assessment average, relative to the standard deviation used for the assessment.
The Z-score shows how many standard deviations a result lies above or below the PT average value.
A Z-score of:
- 0 indicates the laboratory result matches the reported PT average exactly
- Positive values indicate the result is higher than the reported PT average
- Negative values indicate the result is lower than the reported PT average
This standardised approach allows results from multiple laboratories to be compared consistently within an interlaboratory comparison or proficiency testing scheme. Laboratories participating in PT schemes such as the Jet A-1 Proficiency Test Scheme or the H₂S IP 570 Proficiency Test Scheme receive Z-score evaluations as part of their statistical performance report.

Why Z-scores are used in Proficiency Testing
In proficiency testing, one goal is to compare results from multiple laboratories analysing the same test sample under defined conditions.
Z-scores provide a simple, transparent way to evaluate performance by:
- Comparing against laboratories around the world running the same material
- Accounting for the expected variation between laboratories
- Allowing results from many participants to be assessed on a common scale
- Help highlight measurement, training, instrument or user error
Because of this, Z-scores are widely used in proficiency testing schemes designed and evaluated according to:
- ISO 17043 – Conformity assessment for proficiency testing
- ISO 13528 – Statistical methods for proficiency testing
- ISO 4259-3 – Monitoring and verification of published precision data in relation to methods of test
Participation in schemes aligned with these standards helps laboratories demonstrate competence during accreditation assessments and technical audits.
What should laboratories do with their Z-scores?
Proficiency testing results provide valuable insight into laboratory performance when used as part of a structured quality system.
When reviewing Z-scores, laboratories should consider:
Consistent satisfactory results: These indicate that analytical methods and procedures are performing reliably compared with other participating laboratories.
Occasional warning signals: A single result outside the ideal range may occur due to normal variability. Monitoring trends over multiple rounds provides more meaningful insight.
Unsatisfactory results: These should trigger an internal review to identify potential causes such as:
- instrument calibration drift
- method bias
- operator error
- equipment performance issues
Many laboratories document this review process as part of their ISO 17025 corrective action procedures.
Z-Scores and continuous quality improvement
Beyond accreditation requirements, Z-scores are a valuable tool for continuous improvement.
Regular participation in proficiency testing helps laboratories:
- monitor analytical performance over time
- detect bias or method drift
- compare results against peer laboratories
- strengthen confidence in reported data
For laboratories working with petroleum and fuel testing methods, participation in structured schemes such as the Jet A-1 Proficiency Test Scheme or the H₂S IP 570 Proficiency Test Scheme provides an effective way to benchmark performance.